Data on 3,054 Billboard Hits
Every song on Billboard's charts from 1990 to 2025 — downloaded, stem-separated, and analyzed across spectrum, dynamics, stereo image, and phase. Each tool below is an interactive explorer. Click any one to dig in.
Vocal EQ Curve
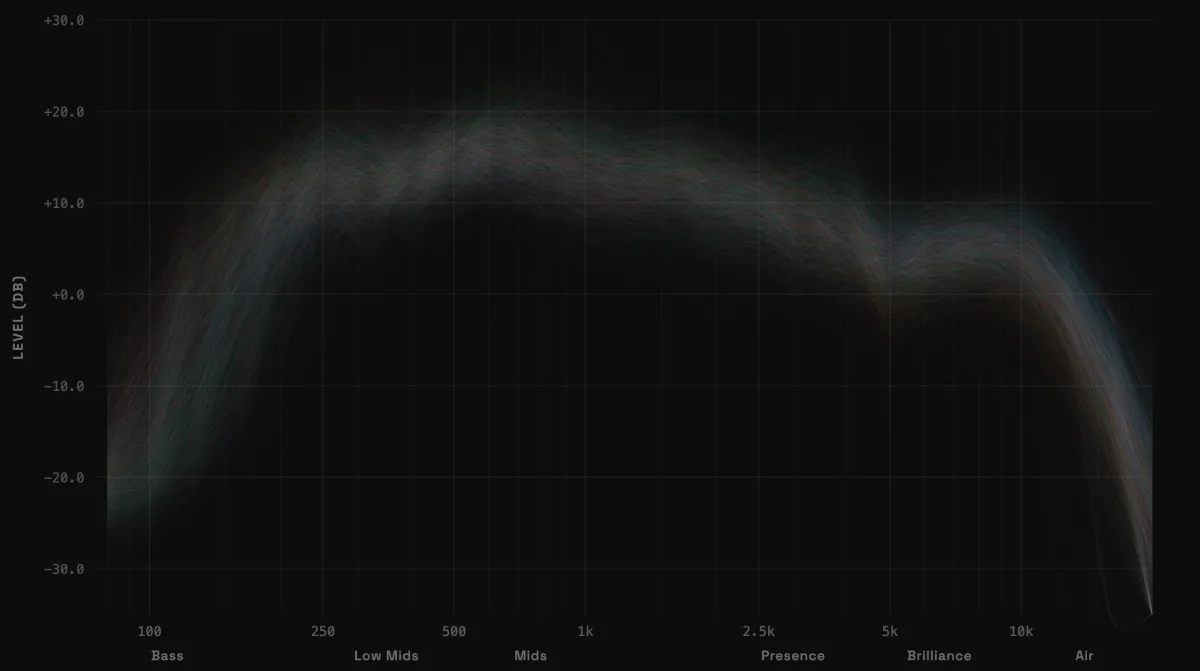
Average frequency shape of 3,054 Billboard Hot 100 vocals, with a spaghetti cloud of every individual song.
Compare genres, pull artist averages, drop in the #1 Hits line, or upload your own vocal to see where it lands.
Vocal Compression
Crest factor of every sung hit vocal from 1990 to 2025. Median 16 dB, and 71% land inside the same 2 dB window regardless of genre, decade or chart position.
Histogram of the pocket with a genre filter, the #1-versus-rest comparison, and what the number means for your compressor.
Drake, Quantified
Every song in Drake's catalog — 439 tracks across 21 albums, 5 eras, and 8 producers — analyzed across mix, melody, structure, lyrics, and drum programming.
Section-structure barcode of all 439 songs at once · energy-curve spaghetti · per-song waveform, pitch, MIDI piano roll, and sheet notation · compare any two scopes side-by-side.
Goniometer / Phase Correlation
Traditional goniometer density cloud. #1 hits have 0.814 phase correlation vs 0.798 for everything else.
Side-by-side diamond scopes comparing #1s to the rest, filterable by genre.
How this was built
Songs pulled from multiple Billboard charts (Hot 100, Country, R&B/Hip-Hop, Rap, Latin, Christian, Gospel, Alternative, Rock, Dance/Electronic, Global 200). Audio downloaded via yt-dlp. 90-second segments extracted from the middle of each track. Vocal and instrumental stems separated with Demucs v4 (htdemucs). All stats are full-segment averages, not instantaneous.
What the data says
- Vocal level: hit vocals sit level with the track, not on top of it. Median -0.4 dB against the instrumental, with country at +2.2 and hip-hop at -3.2. How loud should vocals be?
- Vocal EQ: the energy of a finished hit vocal peaks at 500 to 800 Hz and is 30 dB down by 100 Hz. Genres disagree below 200 Hz by up to 8.5 dB and agree above 2 kHz. Vocal EQ chart by genre
- Vocal compression: a gated crest factor of about 16 dB, in every genre and decade. #1 hits are not compressed harder than the rest. How much compression hit vocals use
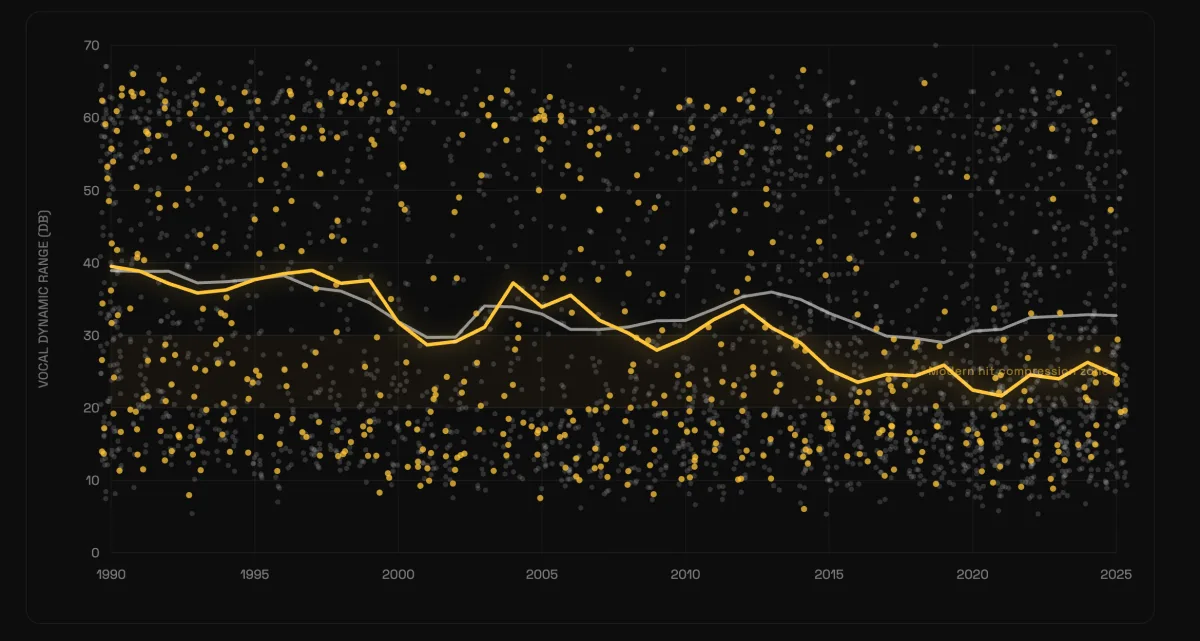
- Vocal dynamics: section-to-section dynamic range fell about 10 dB between the 1990s and the 2000s and has been flat since. Modern vocals are ridden level, not crushed. 30 years of vocal waveforms
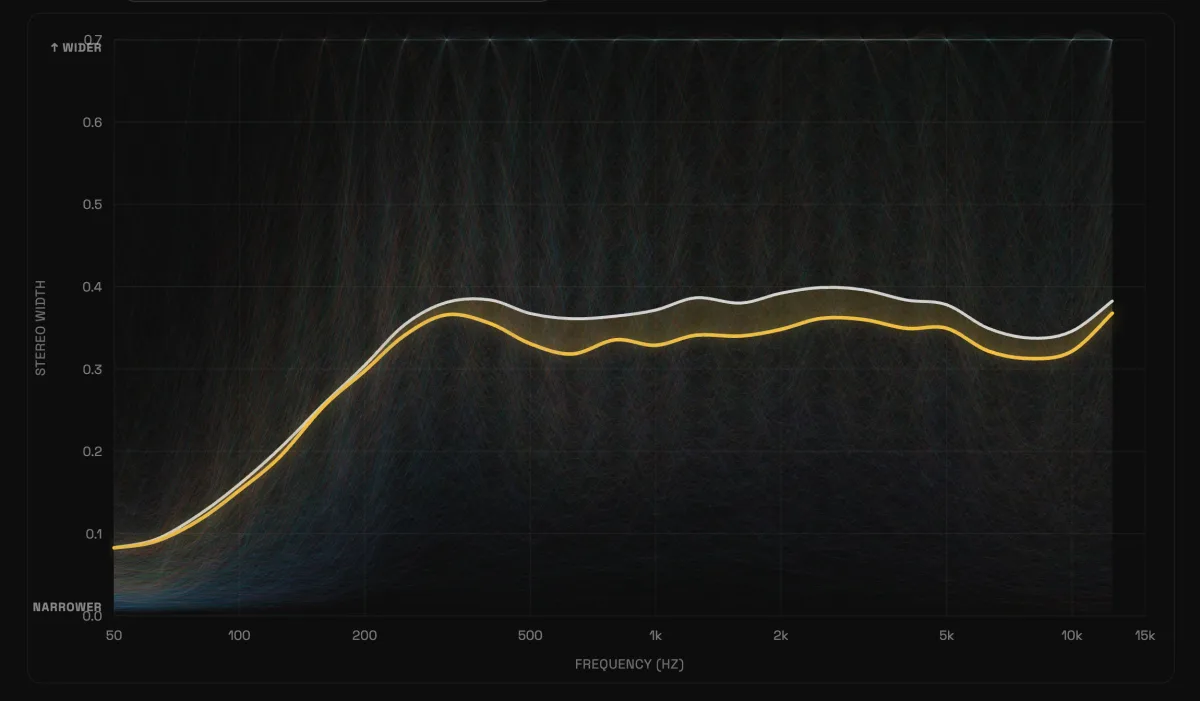
- Stereo width: #1 hits mix about 7% narrower than other hits, and the gap is in the vocal's core, 500 Hz to 2 kHz. Hip-hop is the narrowest genre (phase correlation 0.96), gospel and rock the widest. Stereo width by genre and decade
- One artist, quantified: 439 Drake songs across mix, melody, structure and lyrics. Drake, quantified
Want your own vocal in the dataset? Upload a vocal →